Welcome to the Geospatial Analysis for Environmental Change Lab. Our work focuses on the integration of ecological research with the application of remote sensing, Geographic Information Systems (GIS), and spatial statistics across various spatial (landscape to continental) and temporal scales. We are currently conducting research on modelling the dynamics of surface water extent, vegetation response to flooding, connectivity using network analysis/graph theory and vegetation health assessment using lidar and hyperspectral data. Current work focuses on the Murray-Darling River Basin (MDB), which covers one seventh of Australia and is subject to competing water demands. See current projects.
CURRENT WORK
1. GEOSPATIAL ANALYSIS FOR QUANTIFYING ENVIRONMENTAL CHANGE
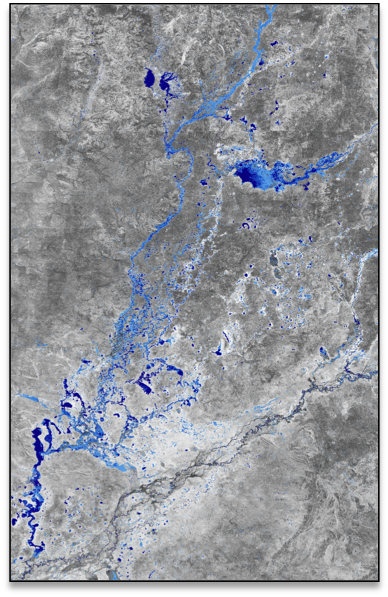
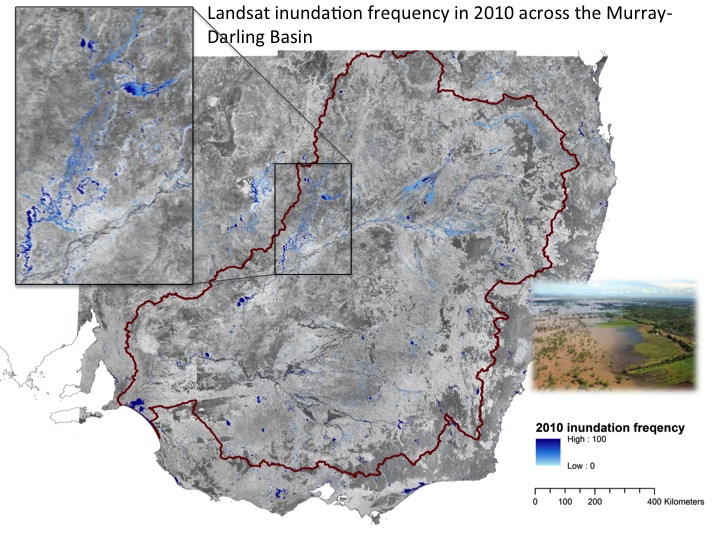
Surface water dynamics across space and time: We have developed an innovative, systematic, internally consistent method that can ingest terabytes of satellite data to map surface water body dynamics in space and time (Tulbure and Broich 2013), which can be applied worldwide.
We have further developed this method and algorithms and applied them to a sub-continental scale (MDB, 14% of Australia) to generate a seasonally continuous time series of flooding dynamics at the highest available temporal and at an unprecedented spatial resolution by processing large volumes of data over three decades using high performance computing. We are quantifying the drivers of surface water dynamics across space and time.
An animation of surface water and flooding extent dynamics (SWD) per year from 1986 until 2011 can be found below. For a larger version of the animation please click here.
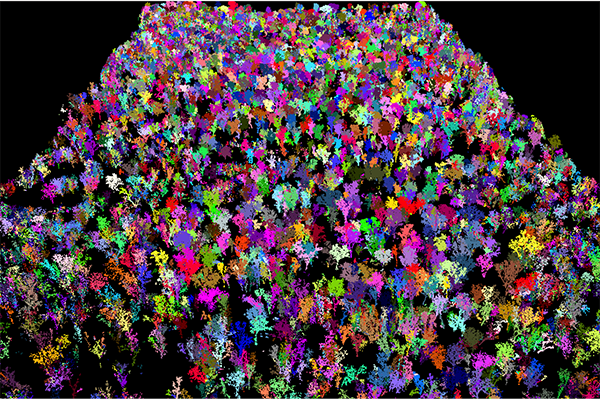
Vegetation health: Integrating airborne full-waveform LiDAR and hyperspectral data, we are quantifying tree health condition. We developed a novel, bottom-up approach that delineates individual trees (see Fig. below) with complex structures such as eucalypts or deciduous trees and trialled our method at the largest river-red gum forest in the world, Barmah-Millewa Forest (Shendryk, et al. 2016).
Vegetation response to flooding: Using time-series of flooding and vegetation dynamics we are quantifying the response of riparian vegetation to flooding.
2. SURFACE WATER NETWORKS USING GRAPH THEORY
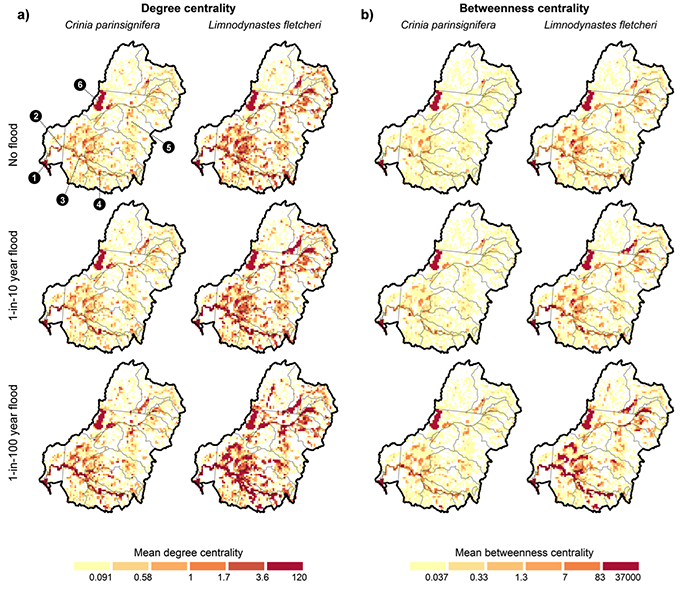
We used time series of Landsat images to map seasonally continuous surface water dynamics over a decade [animation: SurfaceWaterBodies_SwanCoastalPlain.mp4] in a biodiversity hotspot affected by climate change, water abstraction and urban development. Our results showed a decline in number of surface water bodies and amount of surface water since 1999, with a record low in 2010, a particularly dry year (Tulbure and Broich 2013). Innovatively, we integrated graph theory with our surface water maps derived from satellite data and showed that landscape connectivity has declined over time, with potentially negative consequences for aquatic biota (Tulbure et al 2014; [link to news item]). This approach was applied to the MDB using a static surface water layer and flooding scenarios to model amphibian ecological connectivity. We found that flooding was important for facilitating regional- and local-scale ecological connectivity for two example amphibian species and that protected areas (e.g. DIWA, Ramsar) were more important than unprotected areas as connectivity “hubs” (high degree centrality in Fig. below) or “stepping-stones” (high betweenness centrality in Fig. below) especially at higher flooding scenarios (Bishop-Taylor, et al. 2015).
FORMER WORK
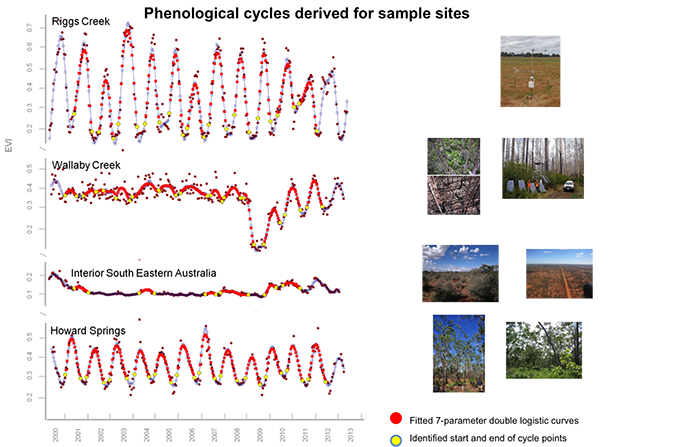
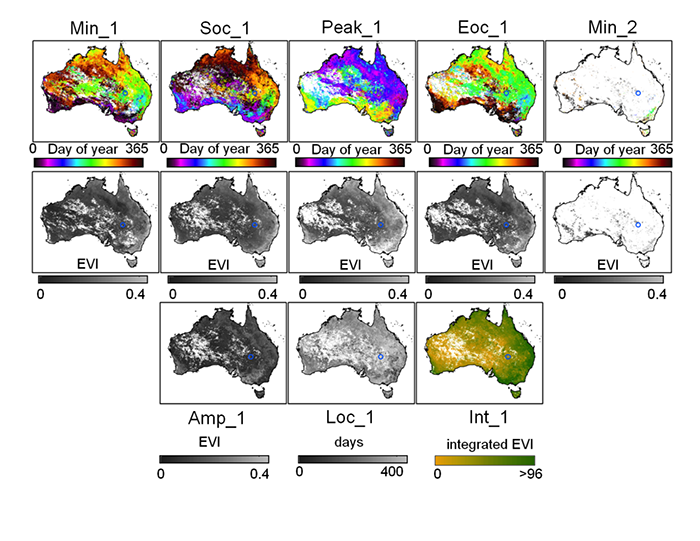
1. AusCover/TERN satellite phenology product for Australia (v1)
In contribution to the Terrestrial Ecosystems Research Initiative’s AusCover remotes sensing facility, Mark Broich developed Australia’s first remote sensing-based phenological characterization product (Broich et al. 2014 & 2015; [link to data]) in collaboration with the University of Technology Sydney.
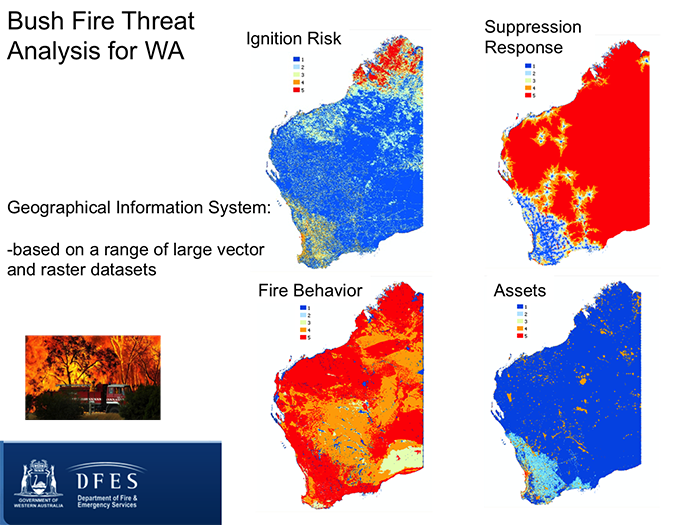
2. Bush Fire Threat Analysis for Western Australia (WA) in support of the WA Department of Fire and Emergency Services
Mirela Tulbure and Mark Broich developed a GIS and remote sensing-based bush fire threat analysis strategic planning tool for all of Western Australia with Murdoch University.
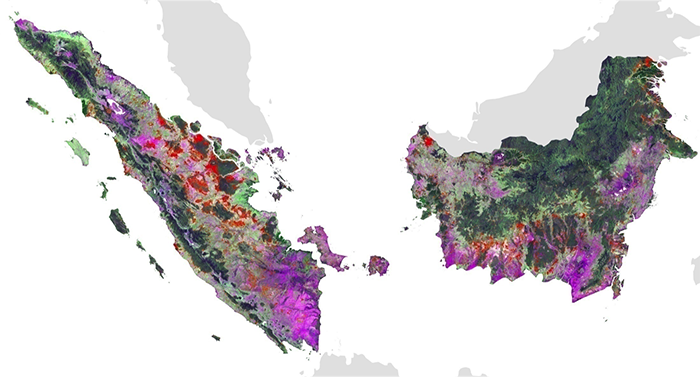
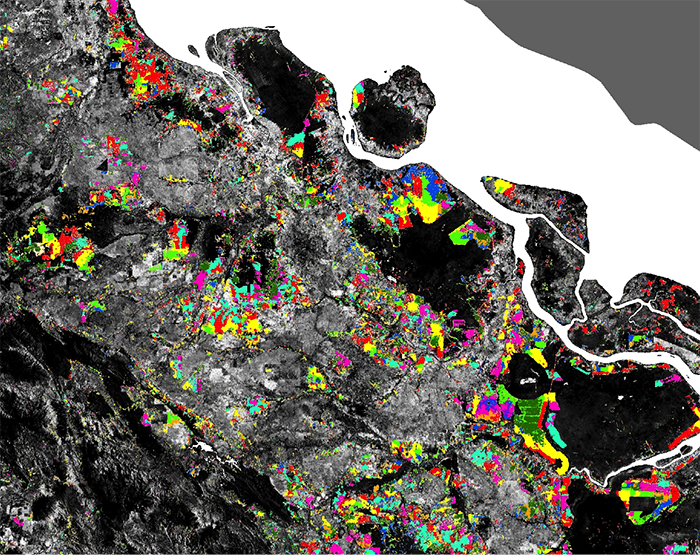
3. Forest cover loss in Indonesia and DR Congo
Funded by NASA, USAID and AusAid, Mark Broich worked with Professor Matt Hansen (UMD) on quantifying humid tropical forest cover loss from Landsat and MODIS remote sensing time series (Broich et al. 2011a, 2011b and others) in contribution to the UN-REDD policy initiative.
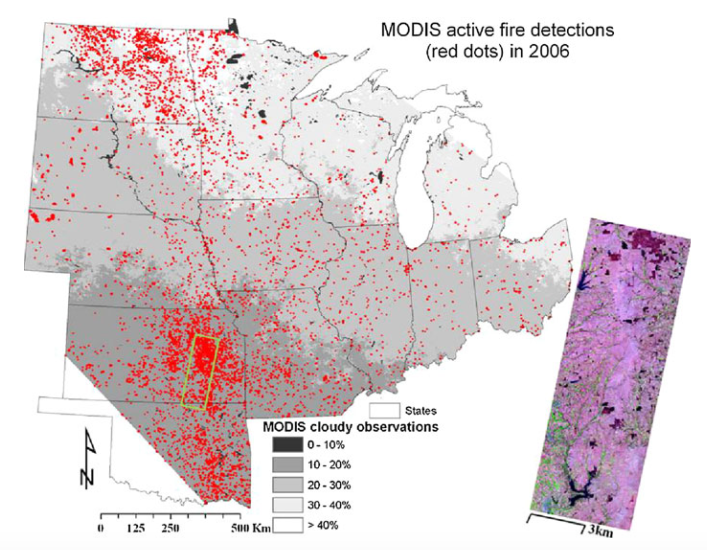
4. Geospatial Analysis of agroecosystems
Mirela Tulbure together with Professor Mike Wimberly utilized large area remote sensing and spatial statistics to understand the environmental impacts of associated land use and land cover change and effects of increasing food and energy needs on cropping patterns in the U.S.
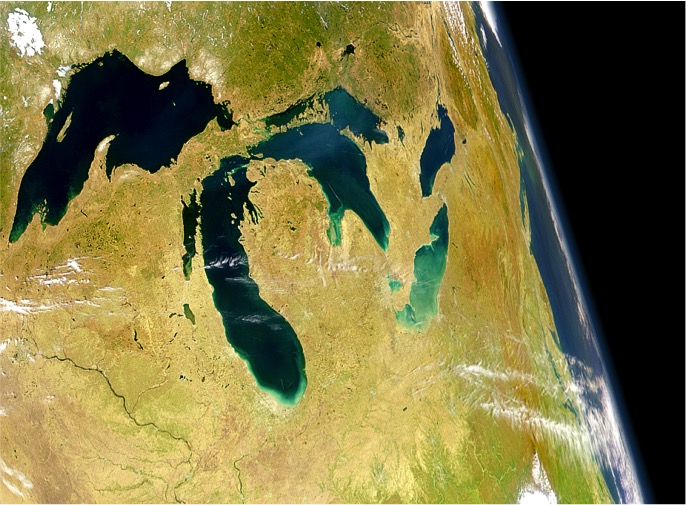
5. Great Lakes Environmental Indicators Project [link]
Mirela Tulbure worked on quantifying factors that influence plant invasion in wetlands and how satellite images can be used for mapping wetland vegetation and invasive species. This work was in collaboration with Professor Carol Johnston.